The 2-by-2 of Forecasting
False Positives and False Negatives are traditionally a topic in classification problems only. Which makes sense: There is no such thing as a binary target in forecasting, only a continuous range. There is no true and false, only a continuous scale of wrong. But there lives an MBA student in me who really likes 2-by-2 charts, so let’s come up with one for forecasting.
The {True,False}x{Positive,Negative} confusion matrix is the one opportunity for university professors to discuss the stakeholders of machine learning systems. The fact that a stakeholder might care more about reducing the number of False Positives and thus accepting a higher rate of False Negatives. Certain errors are more critical than others. That’s just as much the case in forecasting.
To construct the 2-by-2 of forecasting, the obvious place to start is the sense of “big errors are worse”. Let’s put that on the y-axis.

This gives us the False and “True” equivalents of forecasting. The “True” is in quotes because any deviation from the observed value is some error. But for the sake of the 2-by-2, let’s call small errors “True”.
Next, we need the Positive and Negative equivalents. When talking about stakeholder priorities, Positive and Negative differentiate the errors that are Critical from those that are Acceptable. Let’s put that on the x-axis.

While there might be other ways to define criticality1, human perception of time series forecastability comes up as soon as users of your product inspect your forecasts. The human eye will detect apparent trends and seasonal patterns and project them into the future. If your model does not, and wrongly so, it raises confusion instead. Thus, forecasts of series predictable by humans will be critized, while forecasts of series with huge swings and more noise than signal are easily acceptable.
To utilize this notion, we require a model of human perception of time series forecastability. In a business context, where seasonality may be predominant, the seasonal naive method captures much of what is modelled by the human eye. It is also inherently conservative, as it does not overfit to recent fluctuations or potential trends. It assumes business will repeat as it did before.
Critical, then, are forecasts of series that the seasonal naive method, or any other appropriate benchmark, predicts with small error, while Acceptable are any forecasts of series that the seasonal naive method predicts poorly. This completes the x-axis.

With both axes defined, the quadrants of the 2-by-2 emerge. Small forecast model erros are naturally Acceptable True when the benchmark model fails, and large forecast model errors are Acceptable False when the benchmark model also fails. Cases of series that feel predictable and are predicted well are Critical True. Lastly, series that are predicted well by a benchmark but not by the forecast model are Critical False.
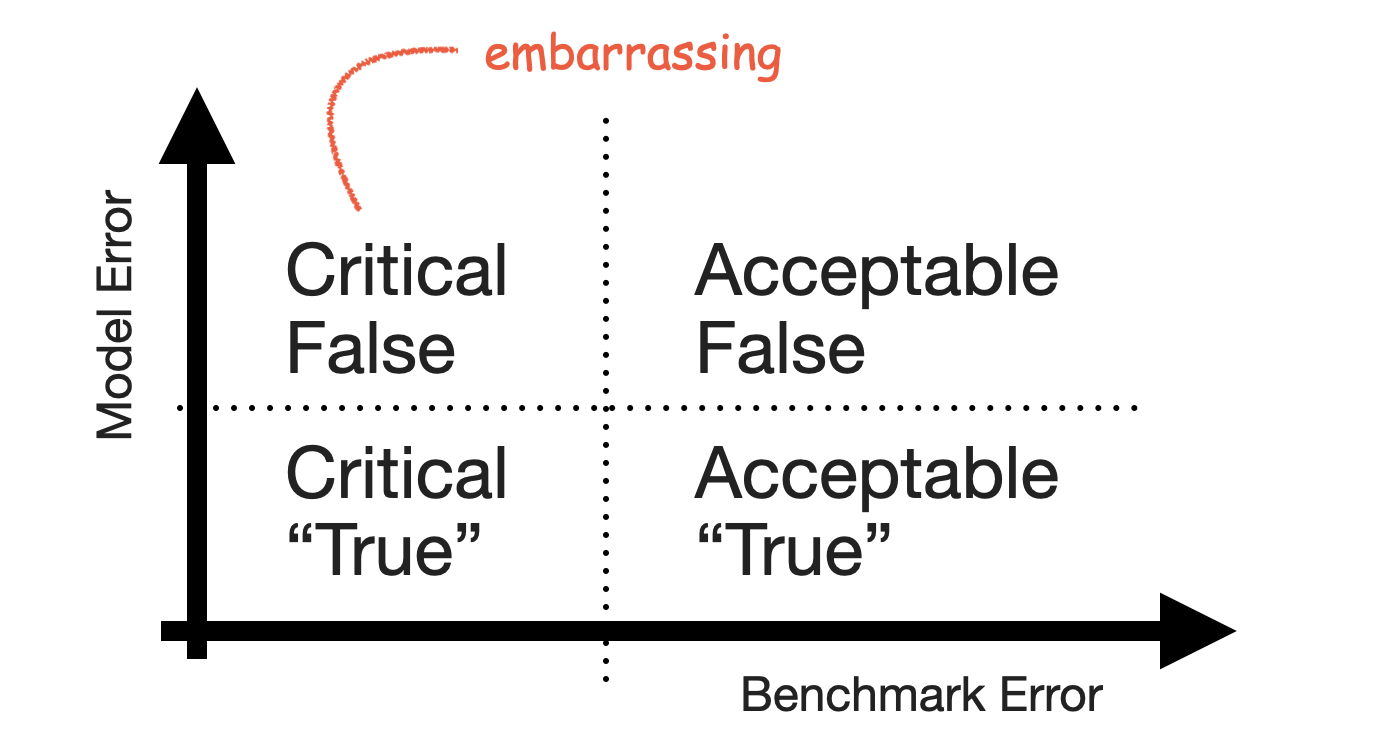
The Critical False group contains the series for which users expect a good forecast because they themselves can project the series into the future—but your model fails to deliver that forecast and does something weird instead. It’s the group of forecasts that look silly in your tool, the ones that cause you discomfort when users point them out.
Keep that group small.
-
For example, the importance of a product to the business as measured by revenue. ↩︎