Threedx
Threedx provides an interface for interpretable probabilistic forecasts that puts you in control.
If you believe in choosing the right model for the job, you’ll love that Threedx let’s you pick the loss function at training time. And at prediction time, Threedx either forecasts by sampling from past observations, or via an innovations generating process you define.
Threedx could be the right fit for you, if…
- your users require interpretability,
- your use case benefits from a custom loss function,
- your data is dominated by seasonality while trends are weak,
- your data is intermittent, non-negative, or otherwise non-normal.
Install Threedx
Install Threedx from Github. Use either pip…
pip install "git+https://github.com/timradtke/threedx"
… or use uv:
uv pip install "git+https://github.com/timradtke/threedx"
See the documentation for more details.
Getting Started
To do anything, you require a time series to predict. Import numpy to generate a fairly short time series of monthly, non-negative observations with a strong yearly seasonality.
import numpy as np

n_obs = 65
period_length = 12
rng = np.random.default_rng(seed=512)

_y = rng.poisson(
	lam=np.maximum(
		0.1,
		1 + 10 * np.sin(
			2 * np.pi *
			np.arange(6, 6 + n_obs) /
			period_length
		)
	),
	size=n_obs
)

y = _y[:(n_obs-period_length)]
y_future = _y[(n_obs-period_length):]
Now import Threedx and initialize the Threedx model with a parameter grid of your choosing. Then fit the model by minimizing a loss function you specify over the provided parameter grid.
import threedx as tdx

model = tdx.Threedx(
	period_length=12,
	parameter_grid=tdx.initialize_parameters_at_random(
		size=2500,
		seed=729,
		include_edge_cases=True
	)
)

model = model.fit(
	y=y,
	loss=tdx.mae # Specify your preferred loss function
)
Draw sample path forecasts for the next period from the fitted model using Threedx’s observation-driven approach.
sample_paths_from_observations = model.predict(
	horizon=period_length,
	n_samples=2501,
	observation_driven=True,
	draw=None,
	seed=388
)
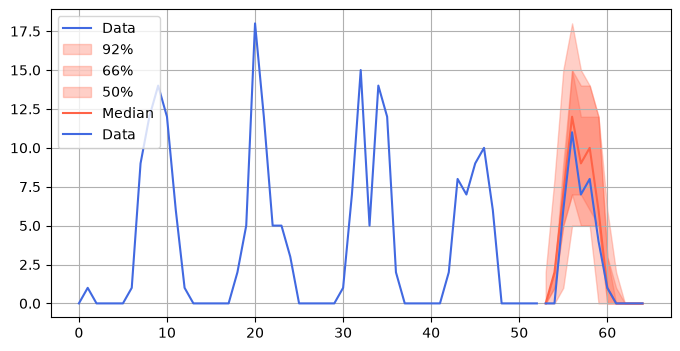
If you’ve installed the optional threedx[graphics] dependencies, you can plot the sample paths as marginal quantiles.
from threedx.graphics import plot_forecast

plot_forecast(
	forecast=sample_paths_from_observations,
	y=y,
	y_future=y_future
)
Refer to the documentation for an extended version of this Getting Started section.